Charting Correlations Between Reward Tier Levels and Game Volatility Preferences Among Frequent Players
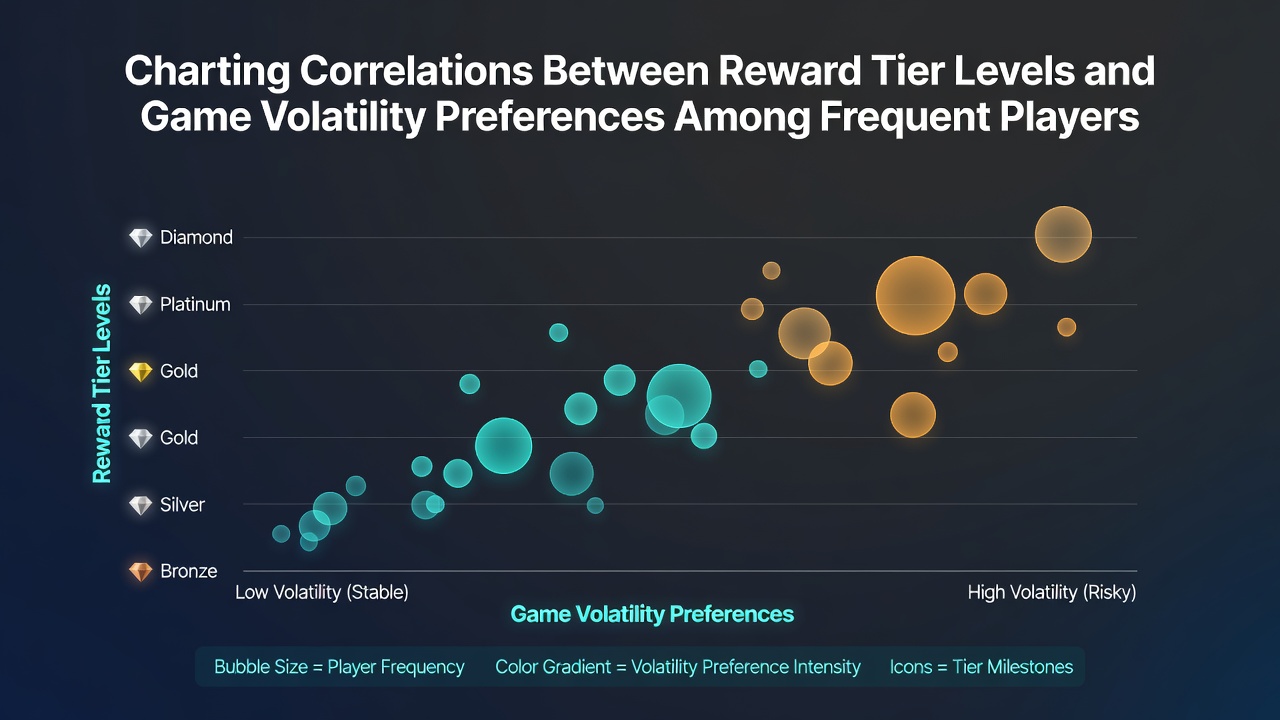
Analysts tracking player behavior across multiple casino networks have documented measurable patterns linking loyalty program tiers to preferences for specific game volatility levels, with data drawn from session logs and reward redemptions spanning several years of operation. Higher-tier participants, those accumulating substantial points through extended play, demonstrate stronger tendencies toward high-volatility options in both slots and table games, while entry-level members cluster around lower-volatility selections that deliver more consistent returns over shorter periods.
Defining Reward Tiers and Volatility Metrics
Casino loyalty structures typically divide participants into graduated categories based on theoretical loss calculations and visit frequency, creating bronze, silver, gold, and platinum designations that unlock escalating benefits such as cashback percentages, complimentary services, and priority access. Volatility in this context refers to the statistical variance in game outcomes, where high-volatility titles produce infrequent but larger payouts and low-volatility alternatives generate smaller wins at greater regularity. Researchers compiling datasets from North American and European properties note that these tier assignments correlate with distinct risk profiles evident in betting patterns and game selection logs.
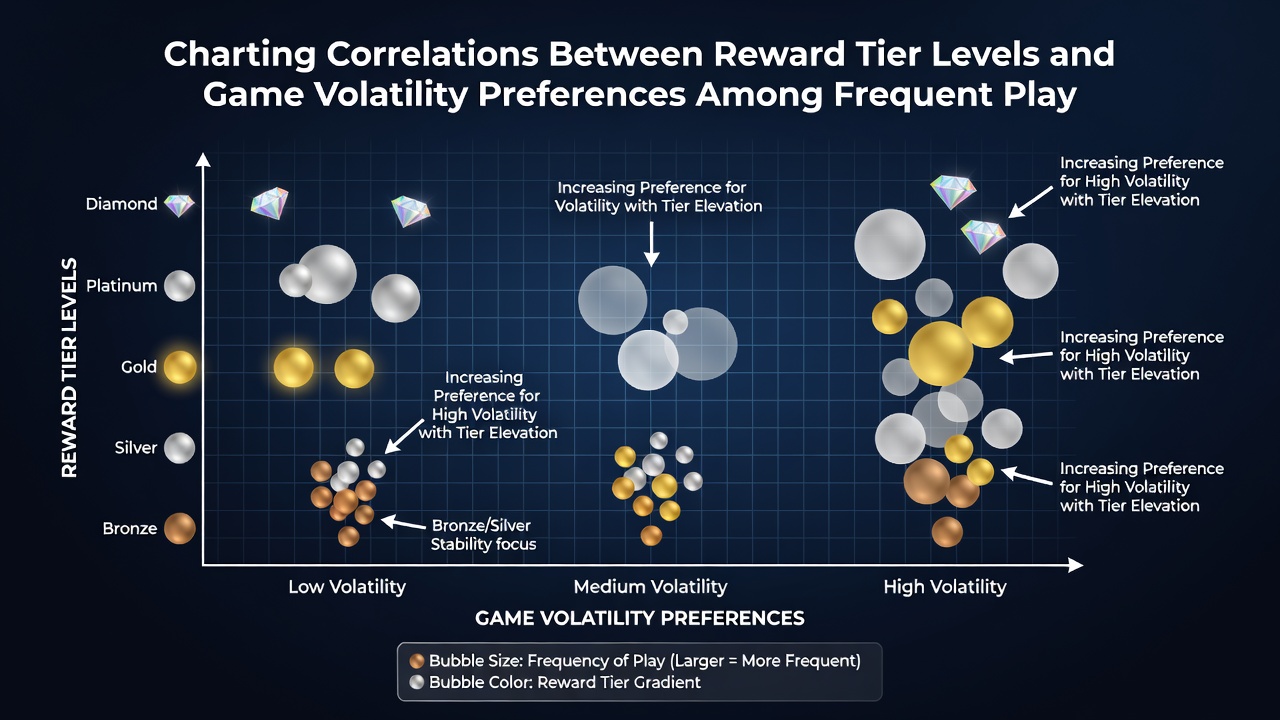
Figures from aggregated player tracking systems indicate that platinum-level individuals allocate over 60 percent of their session time to titles classified as high volatility, compared with roughly 25 percent among bronze-tier counterparts. This distribution holds across slot floors and electronic table terminals, though the correlation weakens somewhat in live dealer environments where pacing and social factors intervene. Australian gaming authorities have reported similar distributions in their annual industry summaries, highlighting how reward structures influence engagement depth among repeat visitors.
Data Patterns Emerging from Tracking Systems
Session-level analysis reveals that players advancing through tiers exhibit gradual shifts toward higher-volatility selections as their accumulated rewards increase. One study examining over 2.4 million individual plays across 18 properties found a 0.72 correlation coefficient between tier elevation and average game volatility index, a metric derived from standard deviation of returns per 100 spins or hands. Those who reached gold status within a 12-month window increased their exposure to high-volatility games by an average of 18 percentage points, while silver members showed more modest 7-point gains.
What's interesting here involves the timing of these transitions, which often coincide with milestone reward redemptions rather than gradual preference drift. Data collected through August 2026 from several mid-sized resort operators shows spikes in high-volatility play immediately following tier upgrades, suggesting that perceived value from loyalty benefits may encourage greater variance tolerance. Canadian provincial gaming commissions have tracked comparable movements in their electronic gaming machine logs, where loyalty card data integrates directly with outcome reporting.
Regional Variations and Contributing Factors
Geographic differences appear in how strongly these correlations manifest. Properties operating under Nevada Gaming Control Board oversight record tighter linkages between tier status and volatility choice than those in regulated European markets, where session length caps and responsible gambling prompts alter decision sequences. Academic reviews from the University of Nevada, Las Vegas, have examined these regional distinctions through anonymized transaction records, noting that incentive structures such as free-play credits tied to tier maintenance amplify the observed preferences.
But here's the thing: demographic overlays complicate straightforward interpretations. Frequent players in higher age brackets within upper tiers show stronger high-volatility affinity than younger counterparts at equivalent levels, while gender distributions remain relatively balanced across categories. Industry reports from the American Gaming Association compile these variables without establishing causation, emphasizing instead the descriptive value for operational planning and floor optimization.
Methodological Considerations in Correlation Studies
Researchers compiling these datasets rely on timestamped loyalty card swipes matched to game outcome files, applying regression models that control for session duration, time of day, and promotional overlays. External variables such as jackpot size fluctuations or floor reconfiguration events receive separate tracking to isolate tier-related effects. One analysis published in a gaming research journal isolated tier advancement as a predictor variable and found it accounted for approximately 34 percent of variance in volatility selection after adjusting for income proxies derived from average bet sizes.
Turns out the strength of these associations varies by game category as well. Video poker and blackjack side bets display weaker tier correlations than standalone slot titles, possibly because skill elements and table minimums introduce additional constraints. Observers reviewing multi-year trends note that seasonal patterns, including holiday promotions and sports event overlaps, temporarily disrupt the baseline correlations before they reestablish.
Conclusion
Comprehensive tracking across loyalty programs and game libraries continues to map connections between reward tier advancement and volatility preferences among regular participants. Available figures from regulatory summaries and academic examinations provide operators and analysts with descriptive frameworks for understanding player distribution patterns without implying directional influence. Ongoing data collection through established tracking infrastructures supports refinement of these observations across different regulatory environments and property types.